|
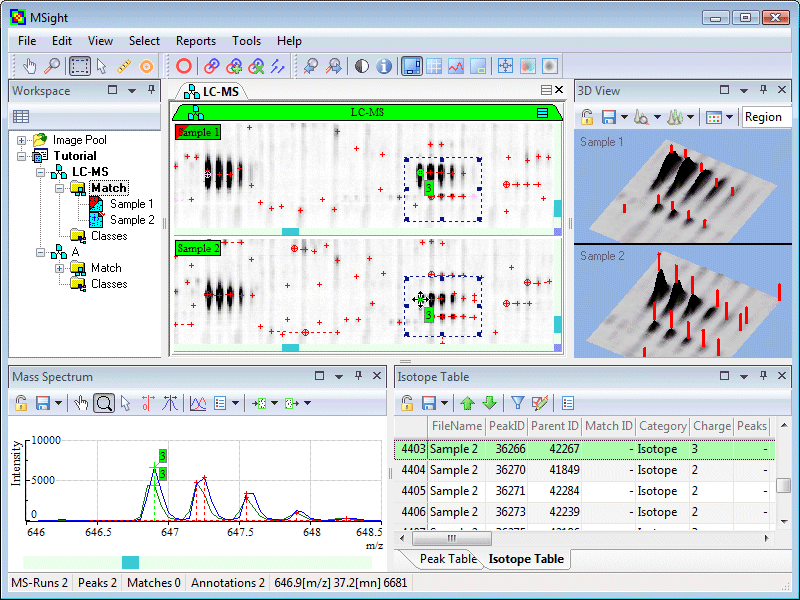
Proteomics techniques have evolved dramatically over the last ten years and have reached a level of maturity. Most current proteomics experiments are aimed at the quantitative profiling of proteins in complex mixtures using high-resolution separations (such as liquid chromatography (LC), capillary electrophoresis or 1D- and 2D-PAGE) followed by mass spectrometry (MS). MS is increasingly used after the separation step to acquire peptide mass and sequence data at a high sampling rate, producing datasets that are highly correlated. Considering that a single dataset can produce thousands of mass spectrum, a high demand has been raised for tools allowing to efficiently assess the quality and reproducibility from these high-throughput data (often over 100 Mbytes). MSight, created by the Proteome Informatics Group in 2005 is now developed and maintained in the Clinical Bioinformatics Group. This tool was specifically developed for the representation of mass spectra along with data from the separation step. The software allows graphical exploration inside huge dataset and gives the scientist access to information that previously was hidden. The software is described in the following paper published in Proteomics (2005; 5: 2381-2384) and poster presented at HUPO and ISMB in 2005. MSight is distributed free of charge. |
|
Key features
Overview |

Supported formatsMSight handles MS and MS/MS data generated from the majority of mass spectrometers as well as generic data formats. For detailed information, have a look to the formats list. |
SurveyThis software is available free of charge, but we rely on your comments and suggestions to enhance MSight. We would appreciate if you could take a few minutes to anonymously answer our very short survey (max. 7 questions) that will help us improve our software. |
|
Version 3.0This version introduces some major improvements:
For more information, see What's new in MSight 3.0. |
|
