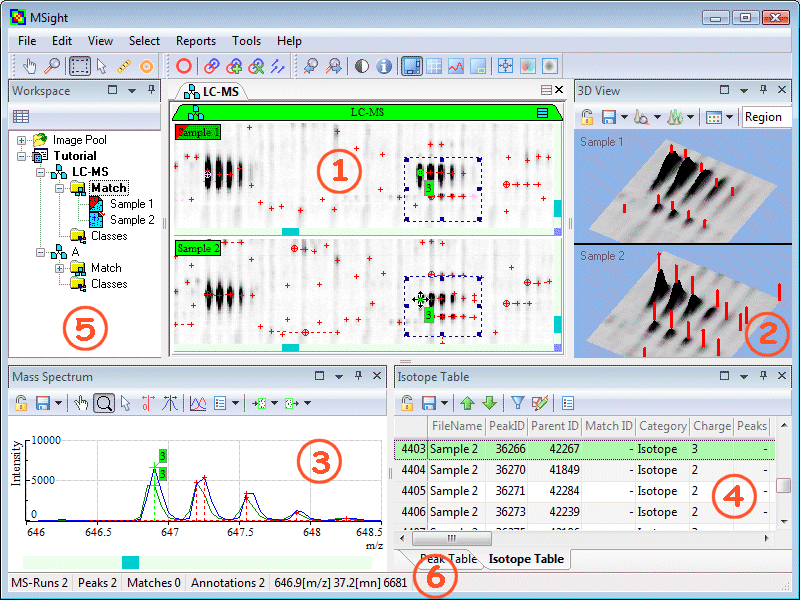
MSight at a glanceA screenshot of the MSight software
1. Two images of two related experiments are displayed in same sheet. |
 |
MSight at a glanceA screenshot of the MSight software
1. Two images of two related experiments are displayed in same sheet. |
 |